Table of Contents
In the first 30-90 days, many teams report a strong positive experience with Snowflake. Many things feels easier, particularly compared to legacy, tightly coupled warehouses:
- Queries are fast
- Storage is relatively inexpensive compared to compute-heavy workloads
- There’s no infrastructure to manage
- Scaling initially feels effortless due to elastic, on-demand compute
For many teams, Snowflake delivers on its promise almost immediately. Data loads work. Dashboards perform well. Analysts are productive. Compared to legacy warehouses, it feels like a clear win. Then, often between months 6 and 12 as adaptation broadens, the mood changes.
Leadership starts asking:
- “Why did our Snowflake bill double?”
- “What’s driving these credit spikes?”
- “Did someone run something expensive by mistake?”
Cost anxiety sets in, not because Snowflake suddenly changed, but because usage did.
The Core Misunderstanding
Here’s the uncomfortable truth:
Snowflake cost problems are rarely caused by platform defects,
and more often by usage patterns and operating models.
They’re caused by:
- How teams use it
- How workloads are structured
- How governance (or lack of it) evolves as adoption grows
Snowflake is intentionally designed to make it easy to consume compute. That’s a feature, not a flaw. But without cost-aware patterns, the same flexibility that accelerates analytics can quietly inflate spend.
In other words, Snowflake rarely creates cost problems; it tends to surface organizational and governance gaps. It exposes organizational ones.
Why Cost Feels “Out of Control”
Similar cost inflection points have been documented across BigQuery, Databricks, and Redshift environments: elasticity accelerates early value, but without guardrails, spend scales faster than discipline.
Cost usually feels unpredictable because:
- Multiple teams start running workloads independently
- Warehouses stay running longer than intended
- Queries scale in complexity faster than governance scales in discipline
- No one owns cost end-to-end
By the time the bill becomes a concern, the behaviors driving it are already normalized.
What This Guide Covers
This guide is designed to remove the mystery from Snowflake cost, without defaulting to blunt tactics like “make everything smaller” or “slow everyone down.” Specifically, it will explain:
- How Snowflake pricing actually works (and where intuition fails)
- Where Snowflake cost really comes from in real-world usage
- How to optimize Snowflake cost without sacrificing performance, trust, or adoption
The goal is not to turn Snowflake into a locked-down system or overly restrictive system. In mature organizations, cost control is not achieved by restricting access, but by making the cost impact of decisions visible at the moment those decisions are made.
It’s to help teams use it deliberately. When Snowflake cost is understood, it becomes predictable. When it’s predictable, it becomes controllable.
How Snowflake Pricing Actually Works (Quick but Precise)
Most Snowflake cost confusion comes from a common issue: teams understand the basics of the pricing model, but miss the behaviors that actually drive spend.
Snowflake pricing is not complicated, but it is unintuitive if you’re coming from traditional databases.
This unintuitiveness stems from Snowflake’s separation of storage and compute, an architectural shift also seen in modern platforms like BigQuery and Databricks, but unfamiliar to teams coming from tightly coupled systems like Teradata or on-premises Oracle.
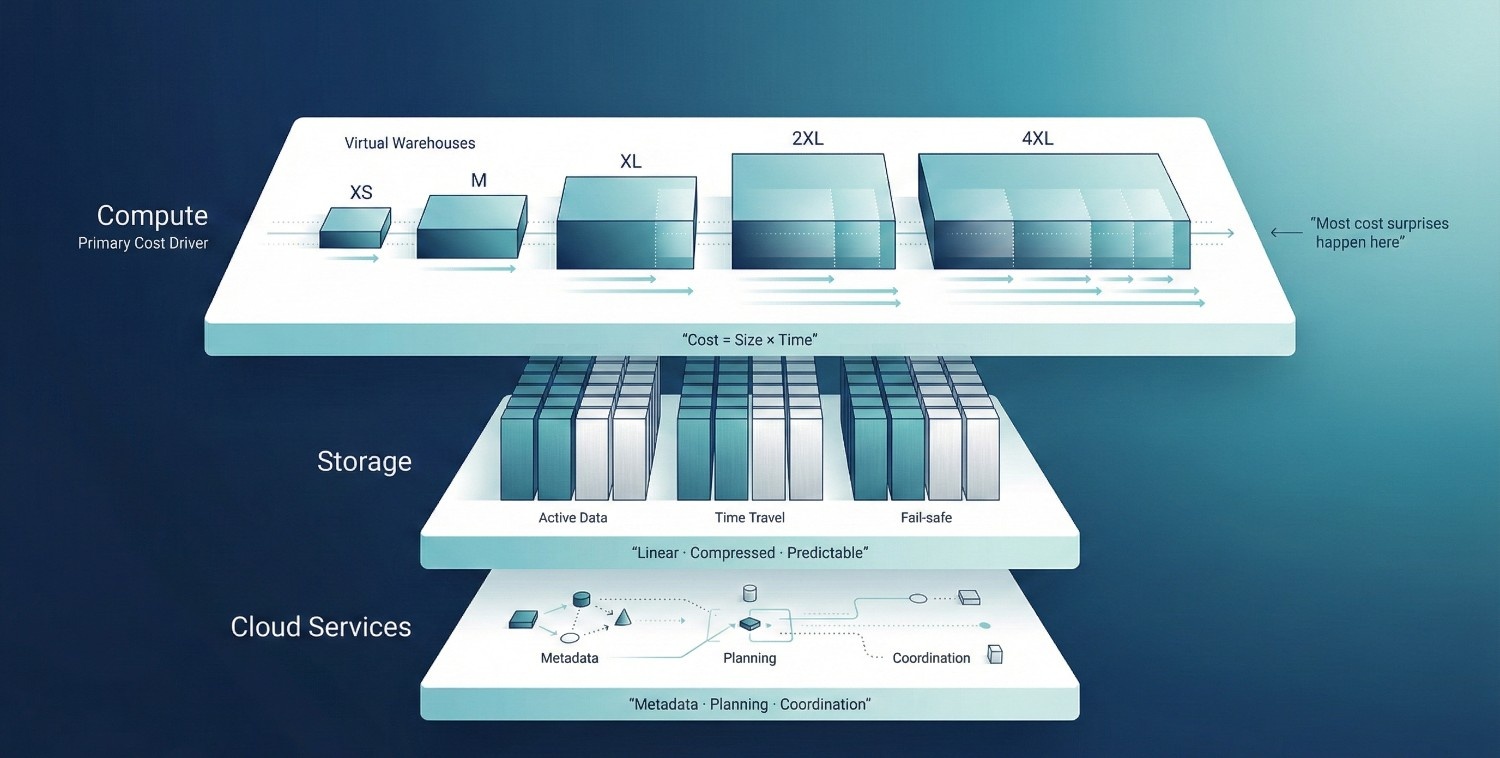
1. Compute (Virtual Warehouses)
Compute is where most Snowflake cost lives. Snowflake charges compute in credits per second, based on the size and active runtime of virtual warehouses. Key mechanics:
- Warehouse sizes (XS → 6XL)
Each size roughly doubles available compute power, and doubles credit burn per second.
- Credits are consumed while the warehouse is running
Even idle, a running warehouse continues to consume credits until suspended.
- Auto-suspend and auto-resume
Auto-suspend stops cost when queries finish. Auto-resume restarts the warehouse when a query arrives. Poorly tuned suspend times are a common cost leak.
- Concurrency vs scaling
More concurrent users don’t always mean a bigger warehouse. Snowflake can queue queries efficiently, but many teams overscale warehouses instead of managing concurrency intentionally.
The most important takeaway:
Snowflake charges for time × size, not for “work done.”
This model mirrors other consumption-based cloud services: efficiency is rewarded only when workloads are actively governed, not simply when individual queries are optimized.
2. Storage
Storage is rarely the real cost problem. Snowflake uses compressed columnar storage, which is generally more compared to legacy systems. However, storage includes more than just “current data”:
- Active data – what queries read today
- Time Travel – historical versions kept for recovery
- Fail-safe – additional recovery layer beyond Time Travel
Why storage usually isn’t the issue:
- Storage costs scale linearly
- Compression ratios are high
- Storage spend is predictable
Most teams are surprised by compute bills, not storage bills. If storage is your main Snowflake cost driver, it typically indicates atypical retention, Time Travel, or data lifecycle patterns.
3. Cloud Services Cost
This is often the least understood, and most surprising, component of Snowflake pricing.
Cloud services cover:
- Metadata management
- Query planning and optimization
- Authentication and access control
- Result caching and coordination
Why this cost surprises teams:
- It’s not tied to warehouse runtime
- It can increase with complex metadata operations and high-frequency control-plane activity.
- Heavy use of views, cloning, and frequent schema changes can increase cloud services consumption.
For most workloads, cloud services cost is modest. But in environments with:
- Extremely high query volumes
- Very complex schemas
- Aggressive automation
it can become visible enough to prompt concern or investigation. Snowflake documentation notes that cloud services usage is typically bundled and minor, but large-scale automation, high-frequency schema changes, or metadata-heavy orchestration can make this layer more visible than teams expect.
The Mental Model to Keep
Snowflake cost is driven by:
- How long warehouses run
- How large they are
- How many workloads run independently
- How disciplined usage patterns are
If you understand those four levers, Snowflake pricing stops feeling opaque, and starts feeling manageable.
The Real Drivers of Snowflake Cost
When Snowflake cost feels “out of control,” the instinct is to look for a technical flaw: inefficient queries, bad schemas, or a need for more aggressive tuning.
In reality, most Snowflake cost growth is driven by usage behavior more than by platform architecture. This mirrors findings from FinOps Foundation benchmarks, which consistently show that cloud cost overruns correlate more strongly with operating models and ownership gaps than with query inefficiency alone.
The platform is doing exactly what it was designed to do. It’s the way teams use it that creates unexpected spending.
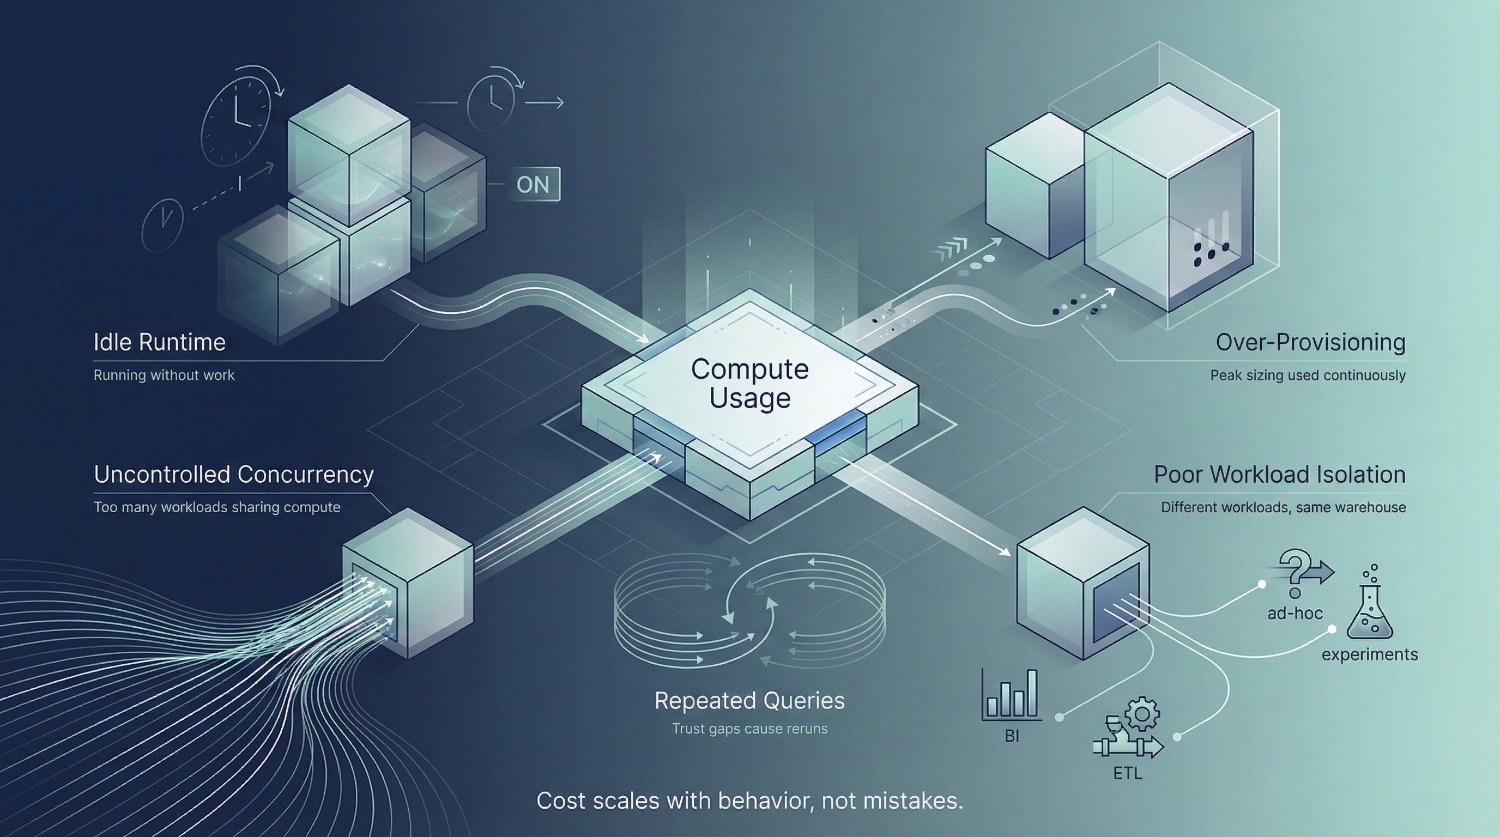
Idle Warehouses
This is the most common and least controversial cost leak.
Warehouses that:
- Stay running after queries finish
- Have long auto-suspend times
- Are manually resumed and forgotten
continue burning credits even when no useful work is happening. Because Snowflake bills per second, idle time accumulates quietly. Individually, it feels small. Over weeks and months, it becomes material.
Idle compute is rarely a performance issue, it’s primarily a discipline and governance issue.
Over-Provisioned Compute
Many teams default to “bigger is safer.” They size warehouses for peak workloads and then:
- Use them for lightweight queries
- Leave them running for ad-hoc analysis
- Never revisit sizing once things “work”
Snowflake makes scaling easy, which can unintentionally discourage continuous right-sizing.
The result is warehouses that are consistently larger than necessary for most of their runtime.
You’re paying for headroom you rarely use.
Unbounded Concurrency
Concurrency is often misunderstood. When many users hit the same warehouse:
- Teams scale the warehouse up
- Or enable multi-cluster mode aggressively
Both approaches increase credit burn. In many cases, the real issue is not insufficient compute, it’s:
- Poor query discipline
- Too many exploratory workloads sharing the same resources
- No separation between heavy and light workloads
Unbounded concurrency can turn Snowflake into a shared cost sink. At scale, concurrency issues are rarely technical bottlenecks. They are signals that workload boundaries and ownership models have not kept pace with adoption.
Poor Workload Isolation
Mixing workloads is expensive. Common examples:
- BI dashboards and ad-hoc queries on the same warehouse
- ETL jobs running alongside interactive analysis
- Data science experiments competing with reporting
Each workload has different performance and cost characteristics. Without isolation, Snowflake often optimizes for responsiveness at the expense of efficiency.
Re-Running Expensive Queries Unnecessarily
This is the least visible driver, and one of the most damaging. It happens when:
- Users don’t trust results and re-run queries “just to be sure”
- Dashboards recompute logic instead of reusing results
- Poor modeling forces repeated heavy joins
These queries are technically valid, but organizationally wasteful. Every unnecessary rerun is a tax on trust and compute.
The Key Insight
Most Snowflake cost problems are not solved by:
- More tuning
- Better indexes (Snowflake doesn’t use them anyway)
- Smarter SQL alone
They’re solved by:
- Clear usage patterns
- Right-sized compute
- Intentional workload separation
- Trust that reduces redundant work
Snowflake cost is behavioral rather than architectural. Until behavior changes, optimization efforts will always feel temporary. Sustainable cost control emerges only when teams align engineering incentives, access patterns, and financial accountability. Tuning alone cannot compensate for misaligned behavior.
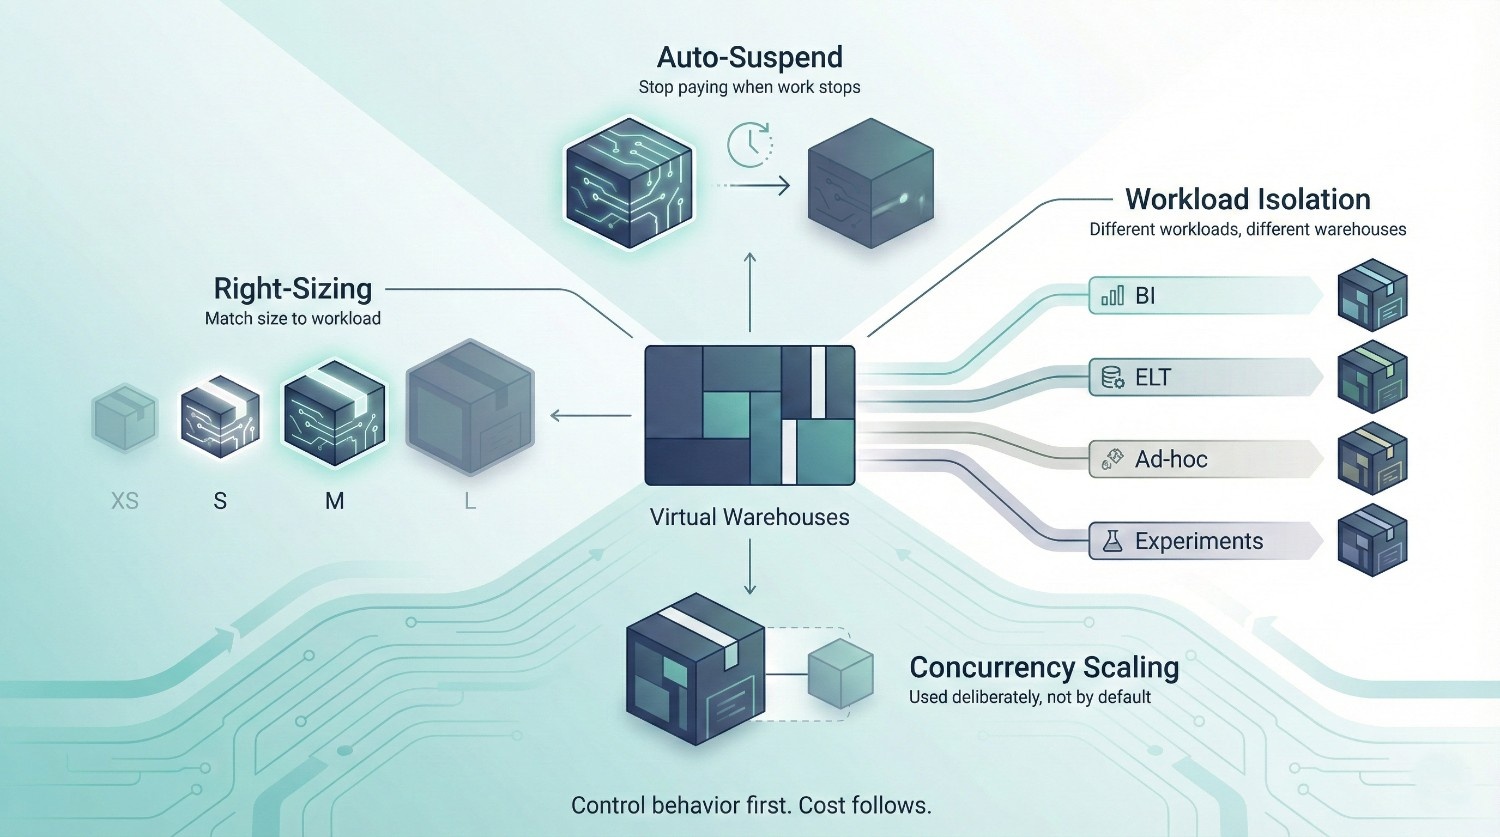
Virtual Warehouse Cost Optimization (The Biggest Lever)
If you change only one thing to control Snowflake cost, make it virtual warehouse behavior. Compute dominates Snowflake spend, and warehouses are where most waste quietly accumulates. The good news: this is also where the highest-impact optimizations live.
1. Right-Sizing Warehouses
A common misconception is that bigger warehouses are always meaningfully faster. They aren’t. What actually happens:
- Many queries don’t parallelize well beyond a certain point
- Small-to-medium workloads often see minimal gains past a specific size
- Larger warehouses burn credits faster even when they’re partially underutilized
Right-sizing means matching warehouse size to workload characteristics, not peak anxiety.
Practical guidance:
- Use smaller warehouses (XS–S) for light BI and ad-hoc queries
- Reserve larger warehouses only for workloads that truly benefit from parallelism (heavy ELT, large scans)
- Revisit sizing regularly, “it worked once” is not a sizing strategy
If a query runs in 12 seconds on an L warehouse and 15 seconds on an M warehouse, the extra speed is rarely worth the doubled cost.
2. Auto-Suspend & Auto-Resume Best Practices
Auto-suspend is one of Snowflake’s most powerful cost controls, and one of the most misconfigured.
Best practices:
- Set auto-suspend aggressively (30–90 seconds for most interactive workloads)
- Avoid “just in case” long suspend times
- Let auto-resume handle user experience
Common misconfigurations:
- Auto-suspend set to 5–10 minutes “to avoid cold starts”
- Warehouses manually resumed and left running
- One-size-fits-all suspend times across very different workloads
Cold starts are typically inexpensive compared to sustained idle compute. Snowflake documentation and field measurements consistently show that cold-start latency costs are negligible compared to the cumulative credit burn of even a single always-on warehouse.
3. Workload Isolation
Mixing workloads is one of the fastest ways to inflate Snowflake cost unpredictably.
Different workloads have different cost and performance profiles:
- ELT – bursty, heavy compute, predictable timing
- BI – frequent, latency-sensitive, consistent patterns
- Ad-hoc analysis – unpredictable, often inefficient
- Data science – experimental, compute-intensive
Running all of these on one warehouse forces Snowflake to optimize for responsiveness, not efficiency.
Best practice:
- Use separate warehouses per workload class
- Size each warehouse for its actual usage pattern
- Apply different auto-suspend settings per workload
Isolation doesn’t just reduce cost, it improves predictability and debuggability.
4. Concurrency Scaling: When to Use It (and When Not To)
Concurrency scaling is often enabled too early and left unchecked. It helps when:
- You have many short, concurrent BI queries
- Query queues are causing user-visible latency
- Workload patterns are consistent and understood
It hurts when:
- Used as a substitute for workload isolation
- Enabled on warehouses with mixed workloads
- Masking inefficient or redundant queries
Concurrency scaling is a scalpel, not a hammer. Use it intentionally, and measure its impact.
Query-Level Cost Optimization
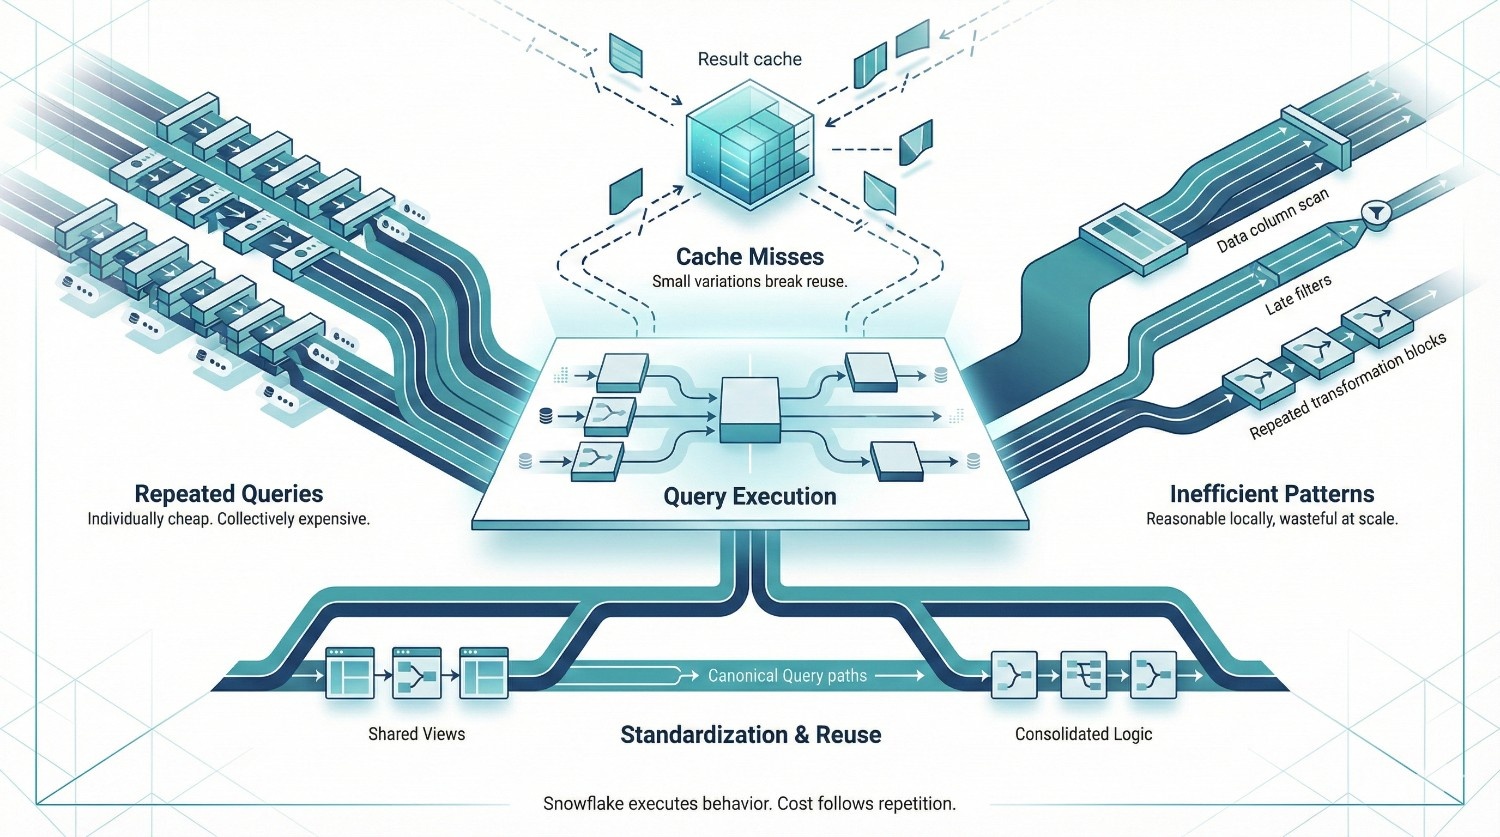
After warehouses, queries are the next biggest Snowflake cost lever, not because individual queries are expensive, but because bad patterns repeat quietly at scale. Query-level optimization is rarely about micro-tuning SQL.
It’s about eliminating wasteful behavior that Snowflake will happily execute forever if you let it.
1. Understanding Expensive Queries
Not all expensive queries look the same. There are two main types you should care about:
Long-running queries
These consume a lot of compute in one go:
- Large table scans
- Complex joins
- Heavy aggregations
They’re visible and often investigated quickly.
Frequently-run queries
These are more dangerous.
- Medium-cost queries run hundreds or thousands of times
- Dashboards refreshing constantly
- Users repeatedly re-running similar logic
Individually cheap. Collectively expensive.
Also distinguish between:
- Queue time – waiting for compute
- Execution time – actually burning credits
If execution time is high, SQL structure or warehouse sizing is usually the issue.
If queue time is high, the issue is usually concurrency or workload mixing, not the query itself.
2. Result Caching (And How to Actually Benefit From It)
Snowflake’s result cache can dramatically reduce cost, but only if you understand how it works.
Key points:
- Cache is reused only for identical queries
- Any change invalidates it:
- Different filters
- Different warehouse
- Underlying data changes
- Cached results typically expire after 24 hours
Why identical queries still cost money:
- BI tools often generate slightly different SQL each refresh
- Timestamps, aliases, or ordering differences break cache reuse
- Different users hitting different warehouses bypass cache
To benefit:
- Standardize queries behind views or models
- Avoid dynamic SQL where possible
- Use consistent warehouses for shared dashboards
Caching rewards discipline. It punishes variation.
3. Query Patterns That Quietly Explode Snowflake Cost
Some query patterns are especially costly because they scale badly with data growth.
SELECT *
- Reads unnecessary columns
- Increases scan cost
- Breaks result caching when schemas change
Unfiltered joins
- Joining large tables without early filters multiplies compute
- Snowflake will scan everything requested by the query
Recomputing the same transformations
- Repeating heavy logic across dashboards
- No reuse via views, tables, or materialized logic
- Each query pays the full cost again
These patterns aren’t “wrong” SQL. They represent reasonable local decisions that become globally inefficient when repeated across teams, tools, and time.
They’re organizational inefficiencies encoded as queries.
The Key Insight
Query-level Snowflake cost is rarely about a single bad query.
It’s about:
- Queries that are slightly inefficient
- Run slightly too often
- By slightly too many users
Multiply that by months, and the bill tells the story. Optimizing queries is less about clever SQL, and more about:
- Standardization
- Reuse
- Reducing unnecessary repetition
Storage Optimization
Storage optimization matters, but it’s rarely where Snowflake cost problems actually live. Many teams fixate on storage because it’s tangible and familiar. In practice, storage is predictable and linear, and usually dwarfed by compute spend. That doesn’t mean it should be ignored, it means it should be handled deliberately, without over-optimizing the wrong thing.
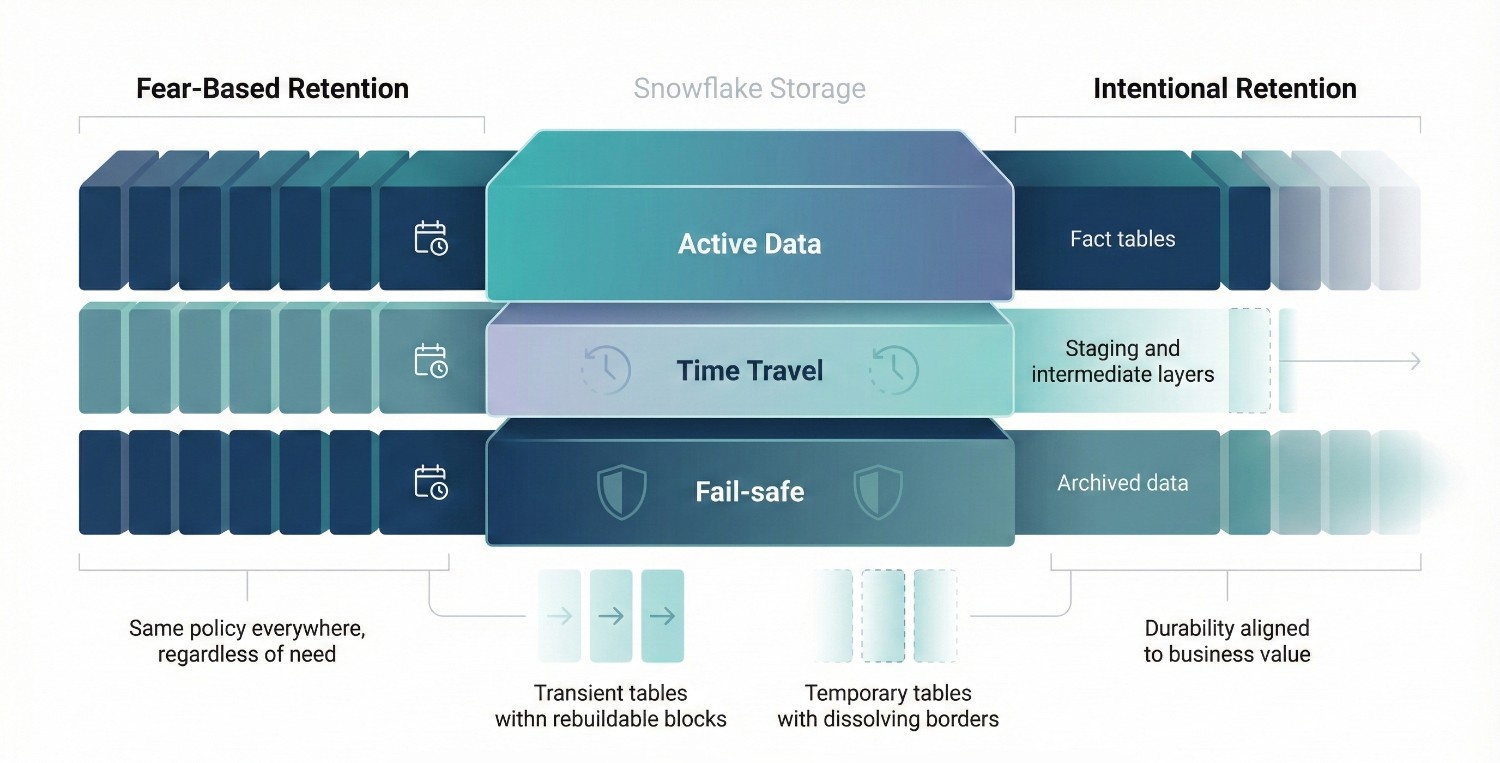
1. Time Travel and Fail-safe Tradeoffs
Snowflake storage includes more than “current” data.
It also includes:
- Time Travel – historical versions of data
- Fail-safe – Snowflake-managed recovery beyond Time Travel
Both are valuable, but not free. Key tradeoffs:
- Longer retention = higher storage cost
- Shorter retention = less recoverability and audit flexibility
Best practice:
- Match Time Travel retention to actual business recovery needs, not fear
- Production fact tables often justify longer retention
- Staging, intermediate, or derived tables usually do not
A common mistake is applying long retention policies universally. This quietly increases storage without improving safety meaningfully. Fail-safe is non-configurable and time-limited, but remember it exists when deciding how aggressive to be with Time Travel elsewhere.
2. Transient and Temporary Tables
Transient and temporary tables are powerful, but frequently misunderstood.
Transient tables
- No Fail-safe
- Optional Time Travel
- Ideal for:
- Staging layers
- Rebuildable intermediate models
- Data that can be regenerated safely
Temporary tables
- Session-scoped
- Automatically dropped
- Useful for:
- Short-lived transformations
- Complex analytical workflows
When not to use them:
- Business-critical datasets
- Anything required for audit, reconciliation, or regulatory review
The goal isn’t to minimize storage, it’s to avoid paying for durability you don’t actually need.
3. Data Lifecycle Management
Most Snowflake environments grow without a lifecycle plan.
Typical symptoms:
- Raw data never archived
- Old partitions queried rarely, but stored forever
- No distinction between “active” and “historical” data
Effective lifecycle management includes:
- Archiving cold data to cheaper storage tiers or external systems
- Pruning unused or obsolete datasets
- Clear retention policies by data class (raw, curated, derived)
A note on partition strategy misconceptions:
- Snowflake handles micro-partitioning automatically
- Manual partitioning rarely reduces storage cost or improves performance
- Poor query patterns, not partitioning, are usually the real issue
Don’t fight Snowflake’s storage engine. Work with it.
The Real Perspective on Storage Cost
Storage optimization is about intentional retention, not aggressive deletion. If you’re spending most of your optimization energy on storage:
- You’re likely optimizing the wrong lever
- Or compensating for lack of compute discipline
Handle storage thoughtfully.
But remember: Snowflake cost problems are almost never solved by deleting data alone.
Snowflake Cost and Data Modeling Decisions
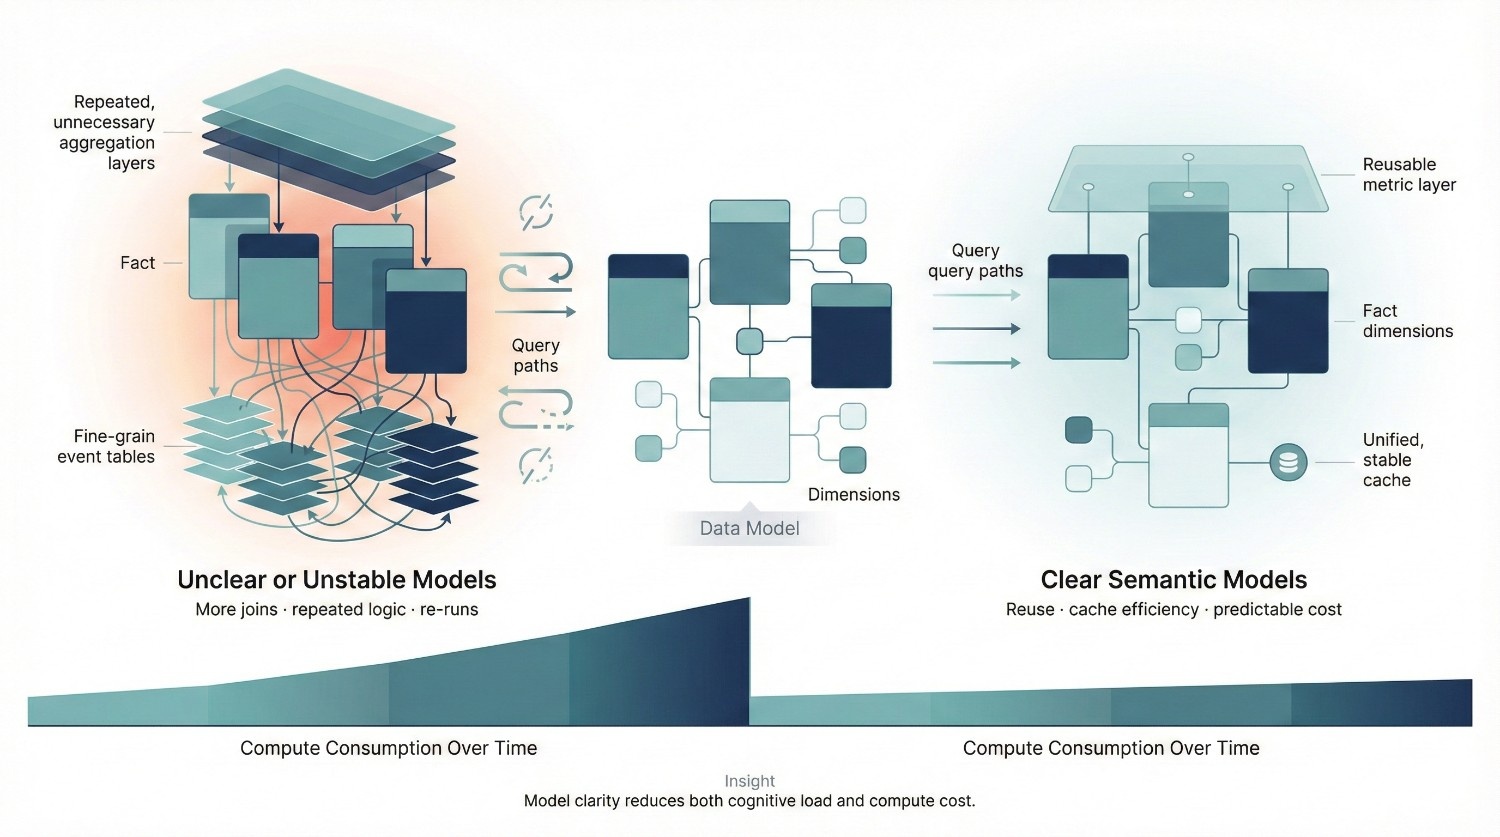
Data modeling choices quietly shape Snowflake cost over time. You don’t see the impact immediately. There’s no single “bad query” to blame. Instead, cost increases slowly as users compensate for unclear models with heavier, more repetitive queries.
How Poor Modeling Increases Compute Cost
When models are unclear or unstable, users adapt in predictable ways:
- They add more joins “just to be safe”
- They re-aggregate data in every query
- They pull more columns than necessary
- They re-run queries to validate results
Each behavior is rational. Collectively, they drive compute usage up. Snowflake executes what you ask; poor models just ask for more work.
Fact Table Explosion
Fact table explosion typically happens when:
- Events are modeled at unnecessarily granular levels
- Multiple overlapping fact tables exist for the same business process
- Incremental rebuilds duplicate historical data
The result:
- Larger scans
- More joins
- Slower queries that demand bigger warehouses
Explosion isn’t always immediately visible in row counts, it shows up in query complexity and repeated computation.
Over-Normalization vs Over-Denormalization
Both extremes increase cost in different ways.
Over-normalization
- Forces many joins at query time
- Multiplies compute cost per query
- Encourages ad-hoc logic duplication
Over-denormalization
- Creates wide tables with unused columns
- Increases scan cost unnecessarily
- Makes schema changes more expensive
Snowflake performs best with balanced modeling approaches:
- Stable fact tables
- Clearly defined dimensions
Reusable metrics defined once, not re-derived
Why Semantic Clarity Reduces Query Waste
Organizations with strong semantic layers consistently report lower query duplication, better cache reuse, and more stable warehouse sizing over time.
When definitions are unclear:
- Users don’t trust shared models
- They build their own logic repeatedly
- Queries diverge just enough to break caching
When semantics are clear:
- Queries converge
- Result caching improves
- Heavy transformations are reused instead of recomputed
This reduces:
- Query volume
- Query complexity
- Re-run behavior
The Key Insight
Clear models do more than improve usability. They:
- Reduce unnecessary compute
- Encourage reuse
- Lower the cognitive load on users
- Make cost behavior predictable
Semantic clarity reduces both confusion and Snowflake cost. If Snowflake cost feels chaotic, the problem is often upstream, in modeling decisions that force users to work harder than they should.
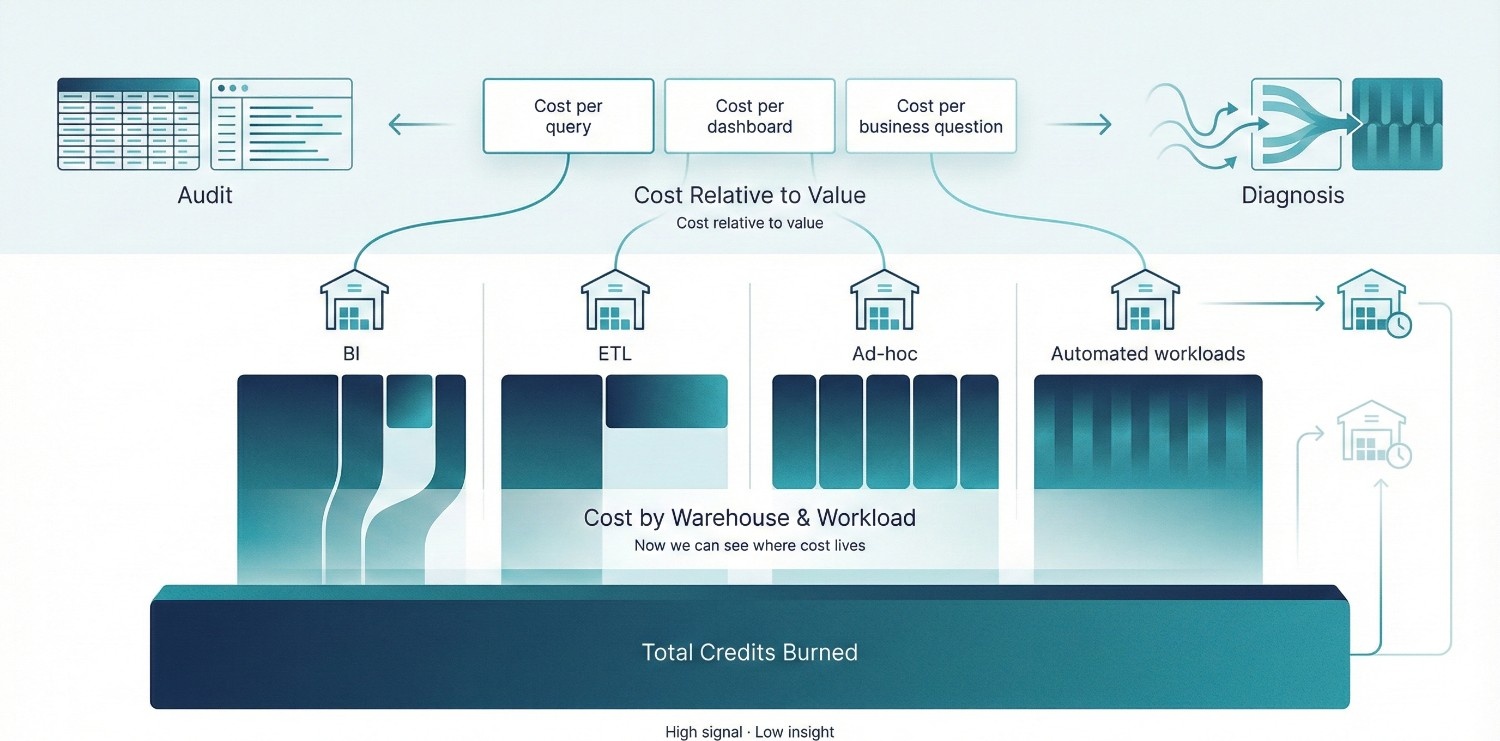
You can’t optimize what you can’t see, but seeing Snowflake cost correctly is more important than seeing it exhaustively. Most teams look at total credits burned and stop there. That’s enough to cause anxiety, but not enough to drive action.
FinOps research consistently shows that teams who stop at total spend metrics tend to overcorrect, while teams that tie spend to workloads and outcomes are far more effective at sustaining control.
1. Native Snowflake Cost Views
Snowflake provides the necessary visibility, if you know how to use it. The most important system views:
ACCOUNT_USAGE.WAREHOUSE_METERING_HISTORY
This is your primary cost lens.
- Shows credits consumed by each warehouse
- Makes idle time and over-provisioning visible
- Helps identify which workloads are actually expensive
ACCOUNT_USAGE.QUERY_HISTORY
In practice, this view is most valuable when used to identify patterns queries that are slightly inefficient but run constantly rather than hunting for one-off outliers.
This is where cost behavior lives.
- Which queries run most often
- Which queries run longest
- Which users and tools generate the most load
This view helps you reliably distinguish:
- One-off expensive queries
- Versus repetitive medium-cost queries that quietly dominate spend
ACCOUNT_USAGE (broader)
Useful for:
- Trend analysis
- Cross-team usage patterns
- Identifying growth trajectories before they become budget problems
The key mistake is using these views only for auditing, instead of diagnosis.
2. What Metrics Actually Matter
Raw credit consumption is necessary, but insufficient on its own. What matters is cost relative to value. Metrics worth tracking:
Cost per query
- Helps identify inefficient patterns
- Useful for tuning high-frequency workloads
Cost per dashboard
- Reveals dashboards that recompute heavy logic constantly
- Highlights candidates for refactoring or materialization
Cost per business question
- The most important metric
- Forces alignment between spend and decision-making
- Exposes when Snowflake is being used for exploration vs repetition
These metrics shift the conversation from:
“Why is Snowflake expensive?”
to
“Which outcomes are expensive, and are they worth it?”
This reframing is critical for executive alignment: it moves Snowflake cost from a finance problem to a portfolio of intentional engineering and analytics decisions.
3. Why Raw Credit Spend Is a Weak Signal
Total credits burned tell you:
- That money was spent
- Not why it was spent
- Not whether it created value
Raw spend:
- Punishes growth without context
- Encourages blunt controls (“slow everyone down”)
- Misses structural inefficiencies
Two teams can burn the same credits:
- One enabling faster decisions
- The other re-running the same queries due to mistrust
The number alone doesn’t tell you which is which.
Predicting Snowflake Cost Before Queries Run
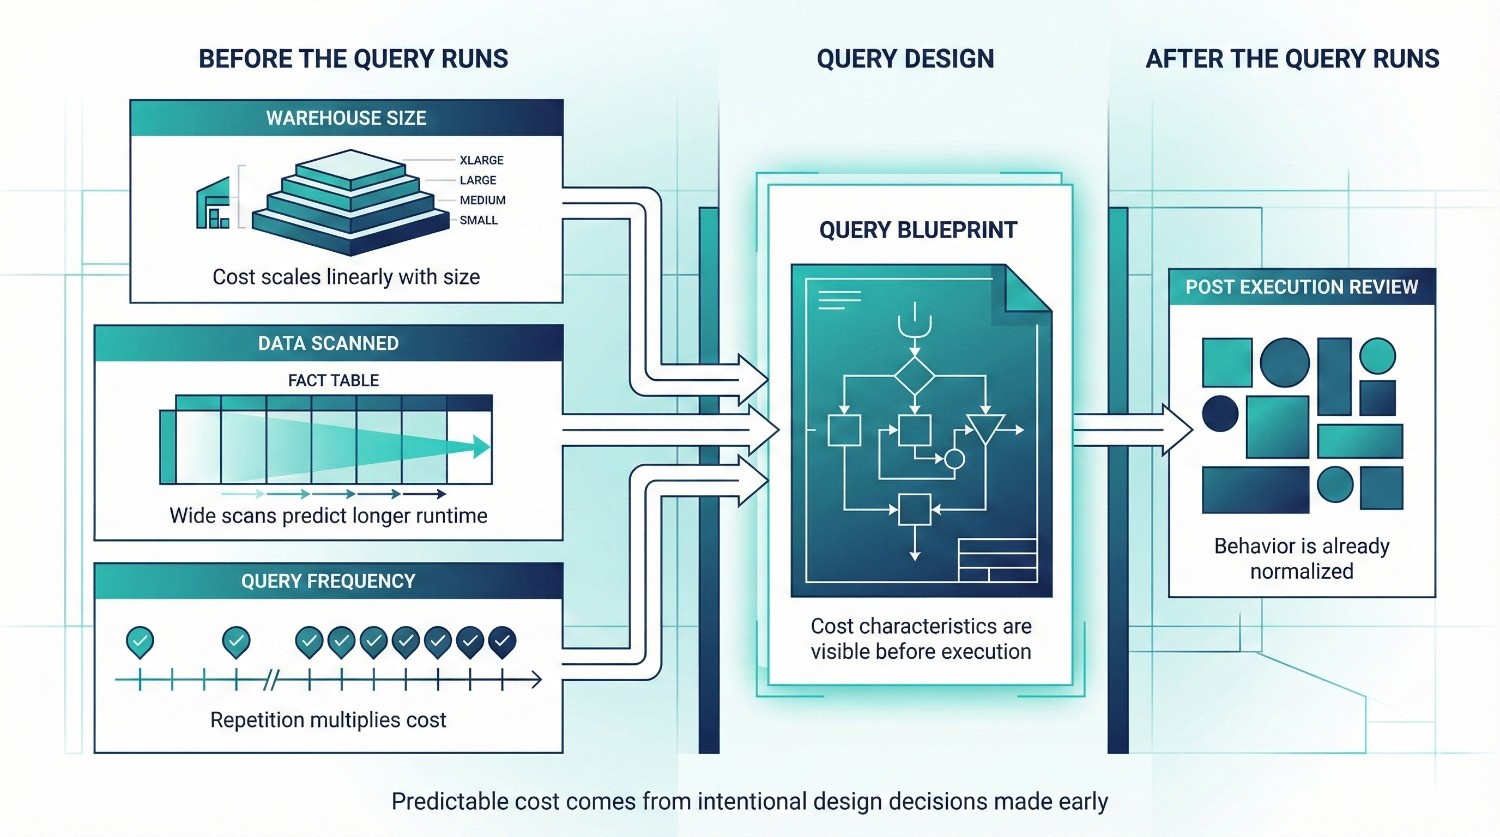
Most teams try to control Snowflake cost after the bill arrives. By then, the expensive behavior is already normalized, and harder to unwind. Predicting cost before queries run is one of the most effective and underused optimization strategies.
Estimating Cost Based on Practical Signals
You don’t need perfect precision to make good decisions. Directional accuracy is enough.
Cost prediction does not require exact credit estimates; it requires early visibility into whether a workload is cheap-by-design or expensive-by-default.
Warehouse size
- Cost scales linearly with size
- An L warehouse burns roughly 2× the credits of an M for the same runtime, all else equal
- If a query requires an L, that decision should be intentional, not accidental
Data scanned
- Large table scans correlate strongly with execution time
- Queries touching wide fact tables or unfiltered joins are immediate red flags
- High scan volume × large warehouse = predictable cost spike
Query frequency
- A query run once is rarely a cost problem
- A query run every 5 minutes becomes one quickly
- Dashboards and scheduled jobs deserve more scrutiny than ad-hoc exploration
A moderately expensive query is fine. A moderately expensive query run hundreds of times is not.
Why Prediction Beats Post-Hoc Optimization
Post-hoc optimization has structural limits:
- You’re reacting to behavior that’s already embedded
- Users are accustomed to existing patterns
- Rolling back “convenient” workflows creates friction
Prediction shifts the conversation earlier:
- “Is this worth running at this frequency?”
- “Does this belong in this warehouse?”
- “Should this be materialized or cached?”
This reframes cost as a design choice, not a failure. Teams that adopt this mindset typically catch high-impact issues during design reviews rather than during billing escalations.
Guardrails vs Policing
Cost control fails when it feels like policing.
Bad patterns:
- Blocking queries after the fact
- Publicly calling out users for high spend
- Sudden restrictions without explanation
Effective guardrails:
- Clear warehouse purpose and sizing
- Expectations around query frequency and reuse
- Shared understanding of cost-impact tradeoffs
Effective guardrails act as defaults and feedback mechanisms, not enforcement tools most users comply naturally when expectations are clear. Policing reacts after trust is already damaged.
Organizational Causes of Snowflake Cost Problems
By the time Snowflake cost shows up as a line item executives worry about, the real causes are already embedded in how the organization works. This is why tuning alone rarely fixes the problem.
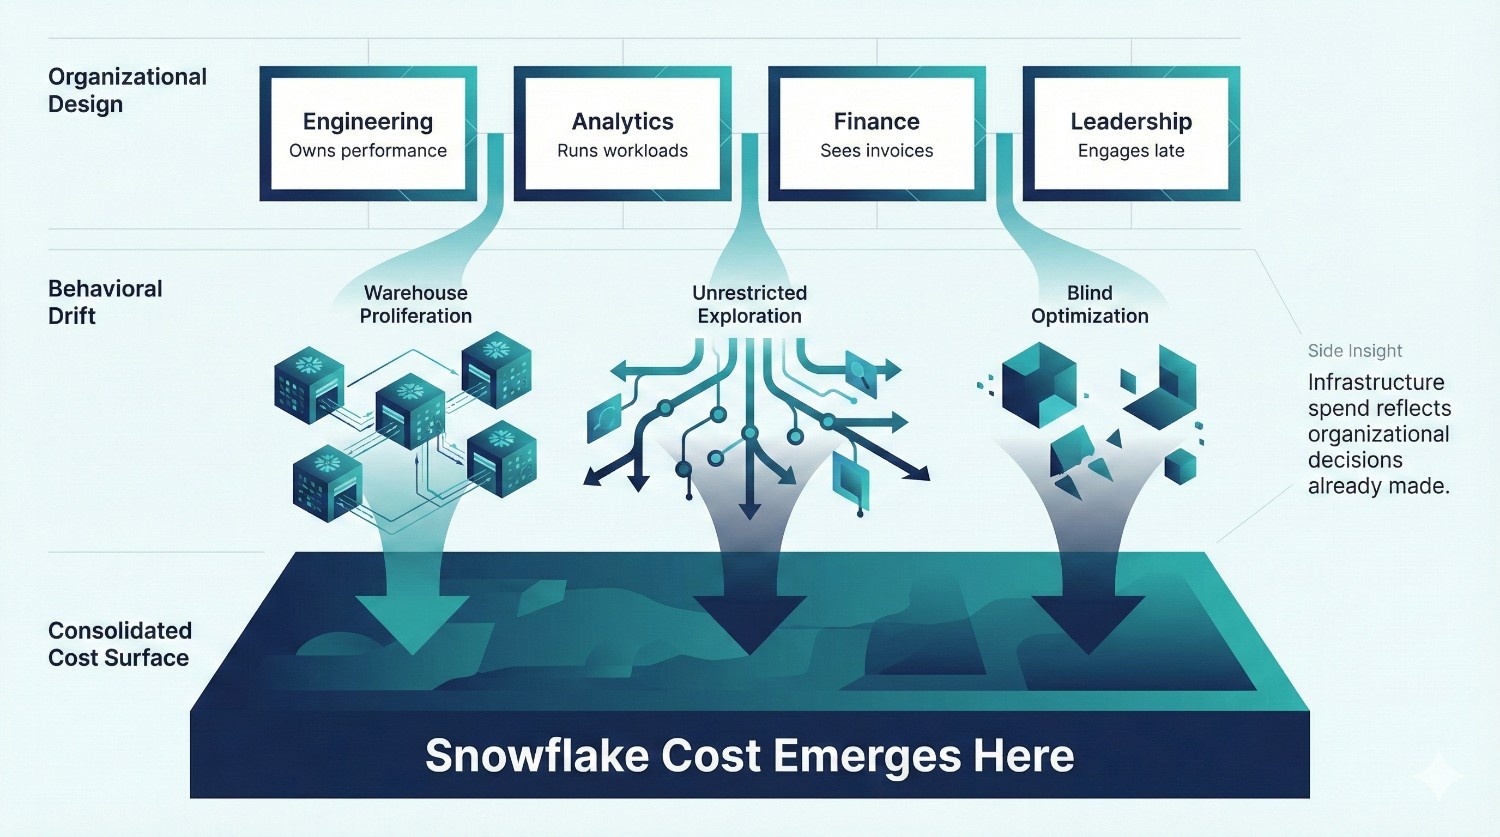
Snowflake cost issues are very often organizational failures expressed as infrastructure spend.
No Ownership of Spend
In many teams:
- No one is accountable for Snowflake cost end-to-end
- Engineering owns performance, not spend
- Finance sees invoices, not behavior
- Data teams sit in between without authority
Without a clear owner:
- Warehouses proliferate
- Usage patterns drift
- Small inefficiencies compound quietly
Cost without ownership is guaranteed to grow. This mirrors broader cloud cost failure patterns, where accountability gaps, not inefficiency are the dominant predictor of runaway spend.
Engineers Optimizing Blindly
Engineers are often asked to “reduce Snowflake cost” with:
- No context about business value
- No clarity on acceptable tradeoffs
- No visibility into which workloads matter most
The result:
- Random warehouse downsizing
- Over-aggressive suspends
- Performance regressions that hurt trust
Optimization without priorities quickly becomes guesswork.
Analysts Running Unrestricted Workloads
Analysts aren’t reckless, they’re doing what the system allows. When:
- All users share the same powerful warehouses
- There are no usage norms or guardrails
- Exploration and production workloads mix
Snowflake becomes an unlimited sandbox with a real invoice. This isn’t an analyst problem. It’s a design and governance problem.
Leadership Only Notices Cost After Invoices Arrive
This is the most damaging pattern. When leadership engagement begins at billing time:
- The conversation is reactive
- Tradeoffs are rushed
- Controls feel punitive
By then, Snowflake cost is already tied to daily workflows. Late attention turns cost optimization into damage control instead of strategy.
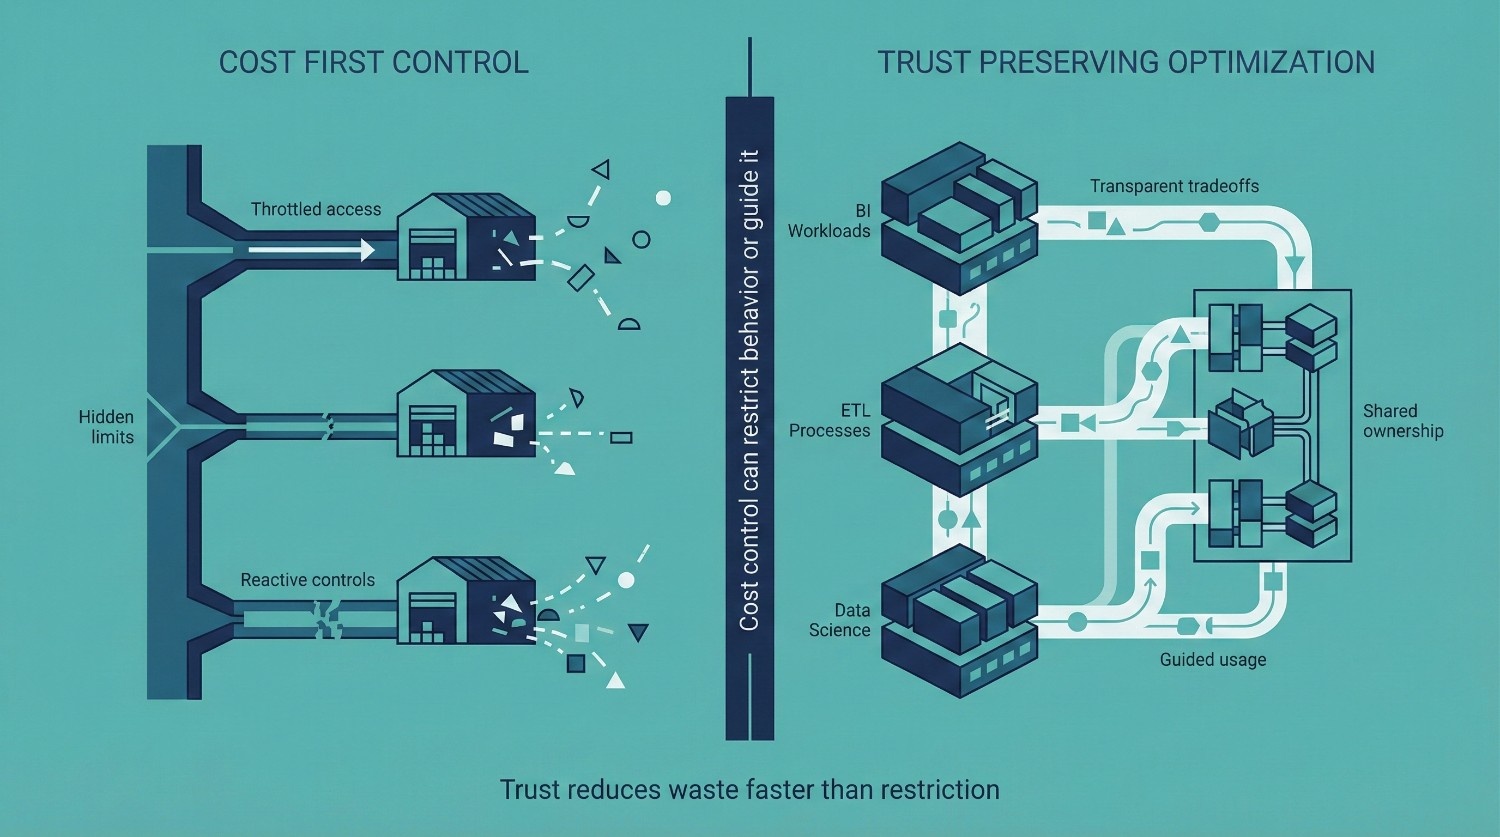
Snowflake Cost Optimization Without Breaking Trust
Most Snowflake cost optimization efforts fail for one simple reason:
They treat cost as a constraint to impose, rather than a system to manage. When cost controls are introduced without context, they don’t reduce waste, they damage trust.
Why Aggressive Cost Cuts Backfire
Blunt cost-cutting measures feel efficient on paper, but they create second-order problems:
- Users lose confidence in the platform
- Workarounds reappear outside Snowflake
- Teams optimize for avoidance instead of efficiency
Once trust erodes, cost actually increases, just in harder-to-see places.
The Danger of Cost-First Tactics
Slowing dashboards
- Breaks executive workflows
- Creates suspicion around data freshness
- Encourages local copies and spreadsheets
Throttling analysts
- Punishes exploration
- Signals that data access is a liability
- Pushes analysis back into shadow systems
Both tactics reduce visible Snowflake cost while increasing organizational cost elsewhere. In mature environments, trust is a leading indicator of cost efficiency: when trust is high, duplication falls and reuse increases automatically.
How to Optimize Cost and Adoption
The goal is not to restrict usage. It’s to align usage with value.
Transparency
- Share which workloads drive cost
- Explain why certain patterns are expensive
- Make tradeoffs visible, not hidden
Shared accountability
- Tie cost awareness to teams, not individuals
- Encourage ownership at the workload level
- Let teams participate in optimization decisions
Business-aligned limits
- Different limits for exploration vs production
- Clear expectations for scheduled workloads
- Guardrails that guide behavior instead of blocking it
When teams understand why cost matters, behavior changes naturally.
Short-Term vs Long-Term Snowflake Cost Optimization Wins
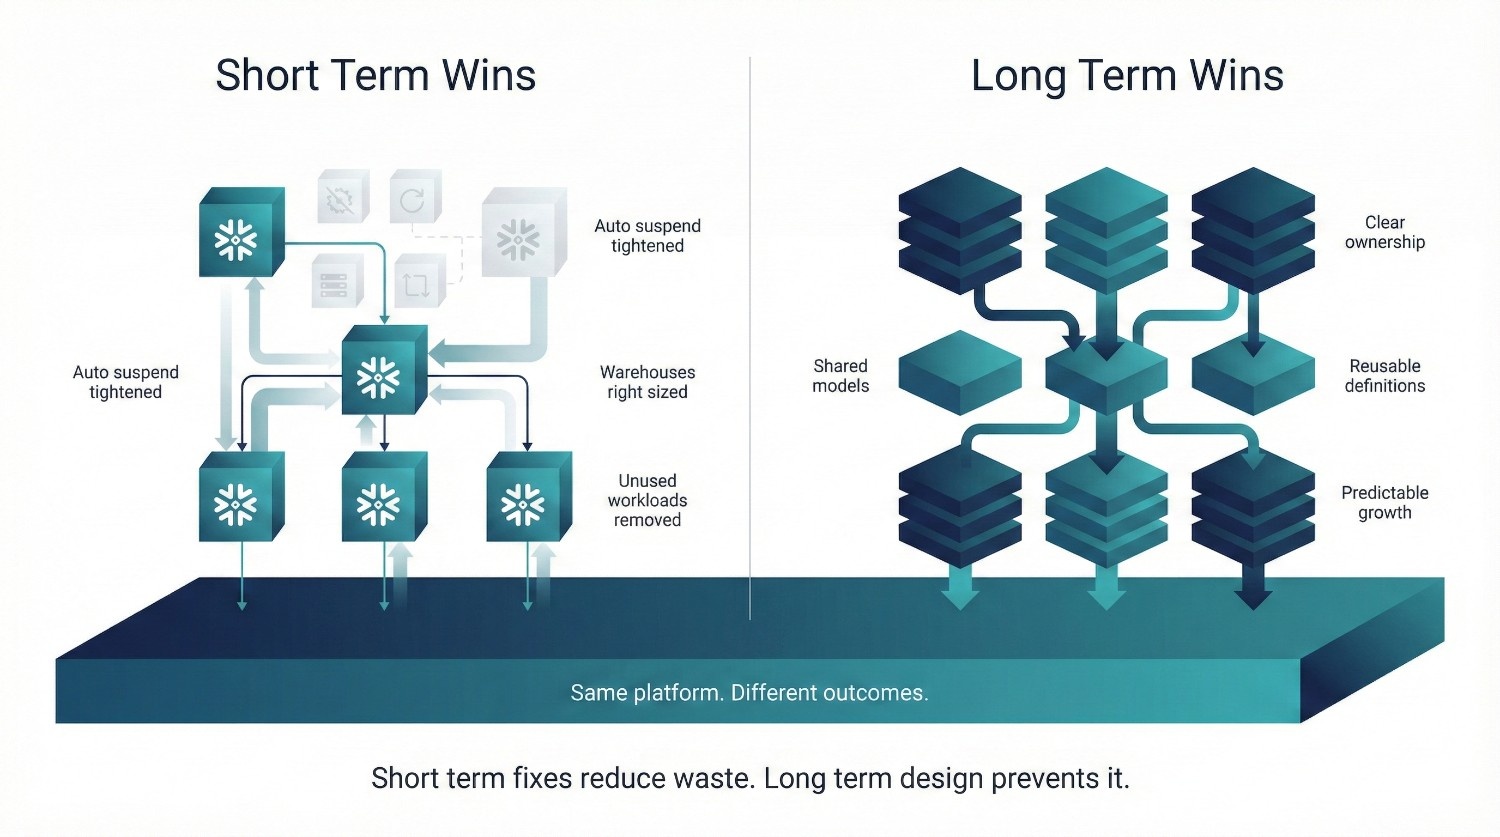
Not all Snowflake cost optimization efforts operate on the same timeline. Some changes produce immediate relief. Others compound quietly over months and deliver far more durable savings.
Teams that only pursue short-term wins usually see costs creep back. Durable cost control emerges when short-term fixes are paired with long-term changes in modeling, ownership, and usage norms.
Short-Term Wins (Weeks)
These fixes reduce Snowflake cost quickly, often within days, without disrupting users if done carefully.
Auto-suspend fixes
- Tighten suspend times on idle warehouses
- Remove manual resume habits
- Eliminate idle credit burn immediately
Warehouse right-sizing
- Downsize warehouses used for light workloads
- Reserve large sizes only for heavy, parallel jobs
- Often cuts compute cost without noticeable performance loss
Kill zombie workloads
- Remove unused warehouses
- Disable abandoned scheduled jobs
- Retire dashboards no one opens anymore
These wins are tactical. They stop obvious waste, but they don’t prevent it from returning.
Long-Term Wins (Months)
These changes are slower, but they reshape behavior and keep Snowflake cost predictable as usage grows.
Better modeling
- Stable fact tables and shared dimensions
- Metrics defined once, reused everywhere
- Fewer heavy joins and repeated transformations
Clear ownership
- Named owners for warehouses and major workloads
- Explicit responsibility for cost and performance tradeoffs
- Faster, cleaner decisions when optimization is needed
Fewer redundant queries
- Reuse through models, views, or materialization
- Reduced re-runs driven by mistrust
- Better cache utilization
Improved data literacy
- Users understand what data represents
- Fewer defensive queries “just to double-check”
- Exploration becomes intentional instead of repetitive
A Practical Snowflake Cost Optimization Checklist
This checklist is designed to be operational, not theoretical. It’s something teams can revisit quarterly, or whenever Snowflake cost starts drifting, without turning optimization into a fire drill.
Use it as a shared reference across engineering, analytics, and leadership.
Warehouses
- Do all warehouses have a clear purpose (ELT, BI, ad-hoc, data science)?
- Are warehouse sizes matched to actual workload needs, not peak fear?
- Is auto-suspend enabled and set aggressively (often 30–90 seconds where appropriate)?
- Are any warehouses running continuously without justification?
- Is concurrency scaling enabled only where it’s been shown to be necessary?
- Does each major warehouse have a named owner?
Teams that treat warehouse configuration as an architectural artifact rather than an operational afterthought tend to catch cost drift before it reaches finance dashboards.
Queries
- Are the most frequently run queries identified and reviewed?
- Are dashboards recomputing heavy logic instead of reusing shared models?
- Is SELECT * avoided in production and shared queries?
- Are joins filtered as early as possible?
- Are expensive queries run on the right warehouse?
- Do users re-run queries because they don’t trust results?
Repeated queries driven by uncertainty are a hidden cost multiplier.
Storage
- Are Time Travel retention periods aligned with real recovery needs?
- Are transient tables used for rebuildable data?
- Are temporary tables used for short-lived transformations?
- Is there a defined data lifecycle (active vs historical vs archived)?
- Are old or unused datasets periodically reviewed and pruned?
Storage won’t save you, but poor retention discipline will quietly add up.
Governance
- Is there clear ownership of Snowflake cost at the platform level?
- Are workload-level tradeoffs understood and documented?
- Are cost guardrails explained, not enforced blindly?
- Are teams encouraged to design for reuse, not duplication?
- Are cost decisions discussed before changes ship?
Snowflake cost problems emerge where governance is absent, not where SQL is bad.
Monitoring
- Are WAREHOUSE_METERING_HISTORY and QUERY_HISTORY reviewed regularly?
- Is spend analyzed by warehouse and workload, not just total credits?
- Are cost trends tracked over time, not just month-end invoices?
- Are metrics like cost per dashboard or cost per business question visible?
- Is monitoring used for learning, not policing?
Monitoring is most effective when reviewed in recurring forums (weekly or monthly), not only during incident response or budget cycles.
How to Use This Checklist
- Run it before Snowflake cost becomes urgent
- Use it during quarterly reviews or growth milestones
- Treat gaps as design signals, not failures
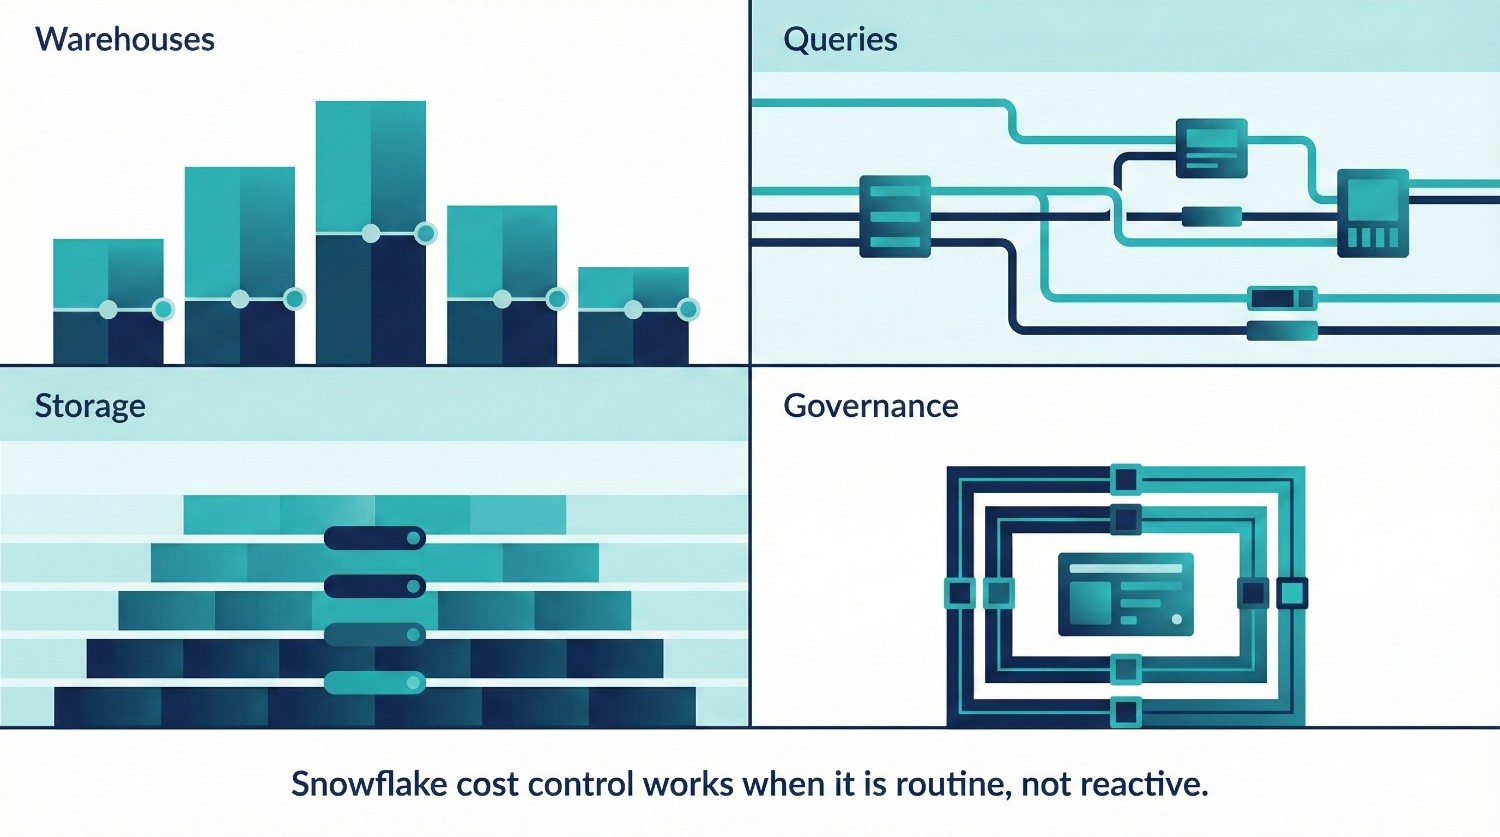
Snowflake cost optimization works when it’s routine, not reactive. When these checks become standard practice, Snowflake cost stops feeling mysterious, and starts behaving like something the organization actually controls.
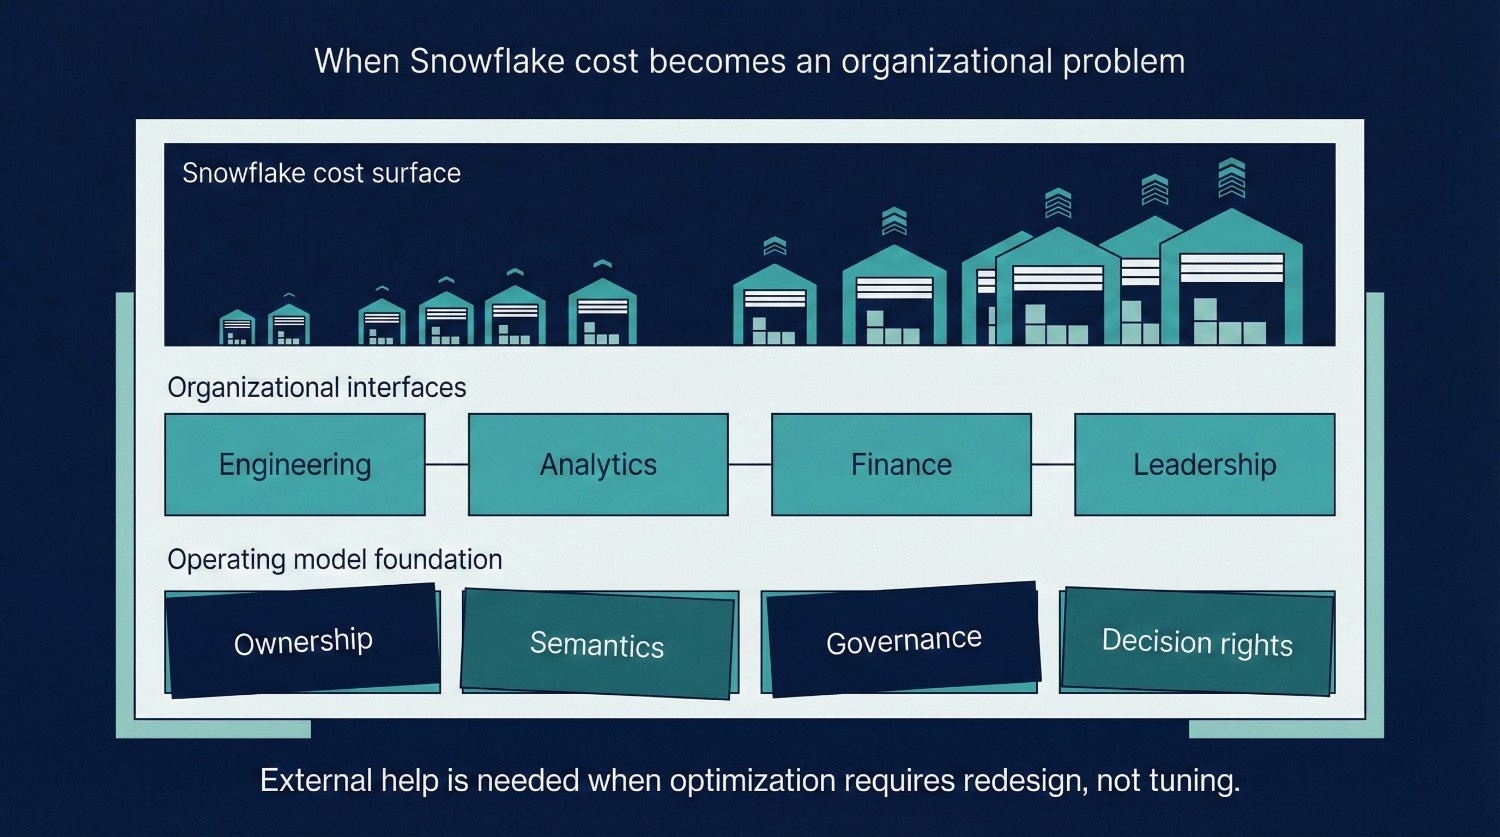
When Snowflake Cost Optimization Requires External Help
Most Snowflake cost problems can be solved internally, up to a point. External help becomes valuable not when teams lack skill, but when the organization struggles to resolve tradeoffs on its own. Here are the clearest signals that Snowflake cost optimization has crossed that line.
Costs Keep Rising Despite Good Hygiene
At this stage, marginal tuning yields diminishing returns; meaningful improvement usually requires revisiting modeling, ownership, or workload boundaries. You’ve already done the obvious things:
- Auto-suspend is configured correctly
- Warehouses are right-sized
- Zombie workloads are gone
- Query patterns are known
Yet spend continues to climb. This usually means:
- Usage growth is outpacing structural controls
- Cost is tied to modeling or semantic decisions, not tuning
- Teams are compensating for ambiguity with heavier queries
At this stage, optimization isn’t about cleanup, it’s about redesigning how the system is used.
Teams Are Arguing Over Who Caused the Spend
Neutral, external analysis often helps depersonalize cost discussions and reframe them around systems rather than individuals.
When cost discussions turn into blame:
- Engineering points at analysts
- Analysts point at dashboards
- Finance points at everyone
That’s a governance failure, not a technical one. External support can help by:
- Reframing cost as a shared system outcome
- Making tradeoffs explicit instead of personal
- Creating neutral visibility into workload behavior
Without that reset, optimization efforts stall in politics.
Optimization Efforts Are Hurting Adoption
This is a critical warning sign. If cost controls lead to:
- Slower dashboards
- Restricted exploration
- Business teams routing around Snowflake
Then optimization efforts are actively destroying value. This usually happens when:
- Cost decisions are made without business context
- Performance tradeoffs aren’t explained
- Controls feel arbitrary or punitive
External perspective helps re-anchor optimization around outcomes, not restrictions.
A Migration or Redesign Is Underway
During major transitions:
- Cost patterns shift unpredictably
- Temporary inefficiencies are unavoidable
- Old and new systems overlap
In these moments, teams often:
- Over-optimize too early
- Or defer cost entirely until it becomes a crisis
External guidance can help:
- Separate temporary from structural cost
- Prevent permanent bad patterns from forming
- Design guardrails that survive the transition
The Real Signal to Watch For
You likely need external help when:
- Snowflake cost conversations stop being technical
- And start being organizational
That’s not a failure of your team. It’s a sign that:
- The system has outgrown informal coordination
- Cost decisions now affect trust, adoption, and leadership confidence
At that point, optimization is no longer about reducing spend.
It’s about designing a cost-aware operating model that the organization can actually live with.
Final Thoughts
Snowflake cost is not an infrastructure accident. It is a mirror. It reflects:
- How teams explore data
- How decisions are made
- How ownership is defined
- How much trust exists in shared numbers
When cost feels unpredictable, the instinct is to look for something to cut. But cutting spend without changing behaviour only treats the symptom.
What Sustainable Optimization Actually Requires
These traits consistently appear in mature data organizations regardless of platform. Snowflake simply makes their absence more visible. The Snowflake environments that stay cost-efficient over time share three traits:
Clear ownership
Someone is accountable not just for performance, but for how and why compute is used. Cost without ownership tends to drift over time.
Intentional design
Warehouses, models, and queries exist for defined purposes. Workloads are separated. Tradeoffs are understood. Nothing runs “just because it always has.”
Measured decisions
Cost is evaluated in context:
- Cost per question
- Cost per dashboard
- Cost per outcome
This shifts the conversation from “How do we spend less?” to “What is this spend buying us?”
The Final Takeaway
The lowest Snowflake bill is not the goal. The goal is:
- Predictable cost
- Confident usage
- High-value decisions per credit consumed
When teams optimize behavior, not just bills, Snowflake stops feeling expensive. It starts feeling intentional.
Frequently Asked Questions (FAQ)
Because early optimizations usually fix symptoms, not behavior. Auto-suspend, right-sizing, and query cleanup reduce obvious waste, but cost becomes unpredictable again if ownership, modeling, and usage patterns remain unclear.
No. Snowflake is often cheaper for the same outcomes. It feels expensive when flexibility is used without discipline. Snowflake exposes inefficient behavior more directly than fixed, capacity-based infrastructure.
Compute usage driven by how long warehouses run and how often queries are repeated. Idle time, oversized warehouses, and redundant queries matter far more than storage.
No. Restricting access usually backfires by:
- Reducing trust
- Slowing decisions
- Creating shadow systems
Cost control should focus on guardrails and transparency, not throttling people
A query becomes too expensive when:
- It runs frequently without reuse
- It scans more data than necessary
- Its business value doesn’t justify its cost
Frequency and purpose matter more than raw runtime.
This is why many organizations pair Snowflake usage data with internal product or decision metrics to understand return on analytics investment.
Because it lacks context. Total spend doesn’t explain:
- Which workloads create value
- Which queries are waste
- Whether cost growth aligns with business growth
Cost per outcome is far more actionable than total credits.
Usually only when:
- Time Travel retention is excessive
- Rebuildable data is stored permanently
- Old datasets are never archived
If storage dominates your bill, something is structurally off.
By:
- Making cost drivers visible
- Aligning limits with business importance
- Sharing responsibility instead of enforcing restrictions
Users change behavior when they understand tradeoffs.
When:
- Teams argue over who caused spend
- Engineers optimize without business context
- Leadership only engages after invoices arrive
At that point, cost is a governance problem, not a tuning one.
Stop asking “How do we reduce the bill?”
Start asking “What behavior is creating this cost, and is it worth it?”
The goal isn’t the smallest Snowflake bill.
It’s the highest value per credit.


