Table of Contents
Snowflake’s usage-based pricing model offers great flexibility, but without proper monitoring, costs can escalate quickly—especially in data-heavy environments. Whether you’re a data engineer, a finance lead, or someone managing cloud infrastructure, keeping tabs on Snowflake expenses is crucial to avoid budget surprises and ensure efficient usage.
The good news is that Snowflake provides several built-in features, alongside third-party tools, to help you track, analyze, and control spend effectively. Keep reading to find out some key metrics and tools that you can use to monitor Snowflake cost.
How Snowflake Costs Work
Before jumping into cost optimization strategies, it’s essential to understand where your Snowflake spending comes from. Costs typically fall into four main categories: compute, storage, cloud services, and data transfer. Among these, compute usually accounts for the largest share—especially if warehouses run longer than needed or aren’t auto-suspended.
Want a deeper breakdown of how each cost component is calculated? Check out our detailed guide on estimating Snowflake costs to get clarity before you start cutting expenses.
Tools to Monitor Snowflake Cost
Monitoring cost in Snowflake is much more than just checking your credit balance. In fact, Snowflake provides a suite of built-in tools that can help you track resource consumption, set thresholds, and manage usage. These tools offer visibility and control to prevent budget surprises and are equally useful for account admins and/or data engineers.
Account Usage Views
Snowflake offers a comprehensive set of system-defined views under the ACCOUNT_USAGE schema. It allows you to analyze historical usage across your entire Snowflake account. These views offer detailed insights into compute usage, query behavior, storage trends, and serverless feature consumption. Hence, they’re ideal for creating cost dashboards, running audits, or triggering alerts based on historical patterns.
You can access these views under SNOWFLAKE database → ACCOUNT_USAGE schema. Some of the most commonly used account usage views include:
- WAREHOUSE_METERING_HISTORY
- WAREHOUSE_LOAD_HISTORY
- QUERY_HISTORY
- STORAGE_USAGE
- TABLE_STORAGE_METRICS
- SERVERLESS_TASK_HISTORY
- MATERIALIZED_VIEW_ REFRESH_HISTORY
Information Schema Views
These views provide real-time or near-real-time metadata and activity monitoring scoped to a specific database. INFORMATION_SCHEMA is particularly useful for developers and engineers who want to check temporary objects, recent query behavior, or table sizes without waiting for ACCOUNT_USAGE view updates.
You can access them at {Select any database} → INFORMATION_SCHEMA schema. Some of the most commonly used account usage views include:
- TABLES
- STAGES
- QUERY_HISTORY
- LOAD_HISTORY
Snowsight
In addition to schemas, Snowflake also provides a modern and interactive web UI (Snowsight) to monitor cost. It is packed with pre-built dashboards for monitoring usage and allows you to explore your data visually—no SQL needed. These dashboards are perfect for high-level overviews, stakeholder reporting, or spotting trends.
You can access it at Snowsight → Admin → Usage, Activity, or Billing. Some of the most commonly used dashboards include:
- Usage → Warehouses
- Usage → Storage
- Activity → Queries
- Billing → Overview
- Billing → Budgets
Resource Monitors
Resource Monitors act as an active line of defense and allow you to enforce compute usage limits through automated alerts or suspensions. They are based on credit thresholds and can be set up at the account or warehouse level. These monitors are great for keeping runaway processes in check or for enforcing monthly spend limits on shared environments.
You can access it at Snowsight → Admin → Resource Monitors or via SQL. A sample query SQL to create a Resource Monitor is shared below.
|
CREATE RESOURCE MONITOR compute_guard WITH CREDIT_QUOTA = 1000 TRIGGERS ON 80 PERCENT DO NOTIFY ON 100 PERCENT DO SUSPEND; |
Budgets and Alerts
Budgets allow you to define soft credit limits for your account, specific warehouses, or workloads. They trigger alerts whenever specified thresholds are hit. In contrast to resource monitors, budgets don’t stop execution. They just help you keep track of financial targets and notify stakeholders, when needed. You can access them at Snowsight → Admin → Billing → Budgets.
Billing and Usage Dashboards
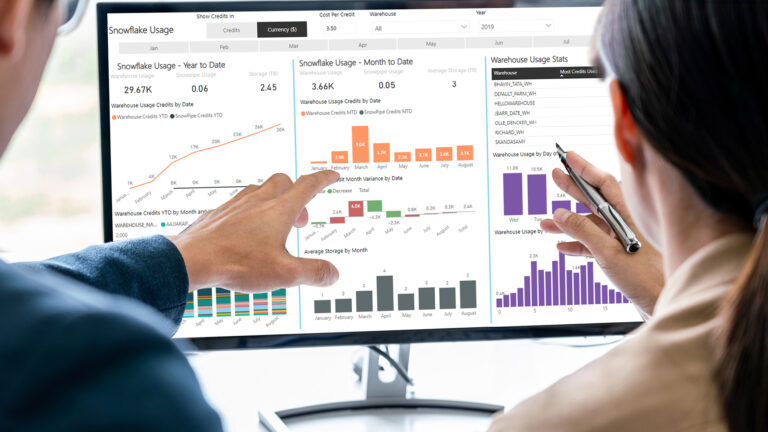
Snowflake offers built-in dashboards that provide time-based breakdowns of your cost and usage trends. These dashboards show daily, weekly, and monthly credit consumption, segmented by user, role, service type, and warehouse. They are particularly helpful for centralized billing, easy export options, finance reviews, and team-level reporting. You can access them at Snowsight → Admin → Billing & Usage
|
Tool
|
Primary Use
|
Access Location
|
Ideal Users
|
Advantages
|
|---|---|---|---|---|
|
Account Usage Views
|
Historical usage tracking (compute, storage, queries)
|
Snowflake.account_usage schema
|
Data engineers, analysts
|
Deep historical data, customizable, supports dashboards
|
|
Information Schema Views
|
Real-time monitoring of objects and queries
|
{db}.information_schema
|
Developers, operations teams
|
Near real-time, scoped by database, good for debugging
|
|
Snowsight
|
Visual overview of usage and performance
|
Snowsight UI → Admin → Usage / Activity
|
Stakeholders, managers
|
Easy to use, no SQL needed, interactive filters
|
|
Resource Monitors
|
Enforce compute credit limits
|
Snowsight → Admin → Resource Monitors (or SQL Query)
|
FinOps, Admins
|
Automatically notify or suspend warehouses on threshold
|
|
Budgets & Alerts
|
Set soft spend limits and trigger alerts
|
Snowsight UI → Admin → Billing → Budgets
|
Finance teams, project leads
|
Custom budgets, email/webhook alerts, track team/project spend
|
|
Billing & Usage Dashboards
|
Daily/monthly spend breakdown
|
Snowsight UI → Admin → Billing & Usage
|
Admins, finance departments
|
Clear billing summary, exportable reports, breakdown by user/warehouse
|
Key Metrics to Monitor for Snowflake Cost
Once we have understood what drives Snowflake costs and what are the tools we can use, the next step is to know how we can monitor them effectively. Snowflake provides a rich set of usage data and views but all metrics are NOT created equal. Some are more relevant to compute, others to storage, and still others to how your queries are running.
Based on that, we can divide the key metrics to monitor Snowflake cost into three main categories – compute, storage, and queries. Let’s start with the largest piece of the cost puzzle, compute.
Metrics to Optimize Compute Cost
Compute costs can fluctuate quickly depending on how you use virtual warehouses and serverless features. Tracking the right metrics helps you to ensure your warehouses are sized properly and idle time is minimized. Similarly, you can keep your serverless operations in control so that they won’t inflate your bill. Below are some of the most important compute-related metrics to keep an eye on.
Warehouse Credit Usage
This metric gives you a clear picture of how many Snowflake credits are consumed by each virtual warehouse over time. You can then filter this view by warehouse name, size, and time window to identify the highest-cost workloads and optimize them.
This metric is found within the WAREHOUSE_METERING_HISTORY view of ACCOUNT_USAGE.
SELECT warehouse_name, start_time, end_time, credits_used FROM SNOWFLAKE.ACCOUNT_USAGE .WAREHOUSE_METERING_HISTORY WHERE start_time >= DATEADD (‘day’, -7, CURRENT_TIMESTAMP()) ORDER BY warehouse_name DESC, start_time DESC; |
Average & Peak Warehouse Utilization
You can estimate average and peak utilization by analyzing how many queries were running compared to the peak number of queries running. A bigger gap between these values could mean your load is varied over time. These insights help you determine if you need to scale down or consolidate workloads.
You can monitor this metric through the WAREHOUSE_LOAD_HISTORY and QUERY_HISTORY views of ACCOUNT_USAGE.
|
SELECT warehouse_name, AVG(avg_running) AS avg_ concurrent_queries, MAX(avg_running) AS peak_ concurrent_queries FROM SNOWFLAKE.ACCOUNT_USAGE .WAREHOUSE_LOAD_HISTORY WHERE start_time >= DATEADD(‘day’, -7, CURRENT_TIMESTAMP()) GROUP BY warehouse_name ORDER BY peak_concurrent_queries DESC; |
Auto-Suspend & Resume Activity
It is not an optimal setting if your warehouses are being suspended and resumed too frequently. Monitoring this can help you resolve this issue by adjusting your auto-suspend settings. You may need to improve the scheduling or use job batching to minimize inefficiencies.
You can monitor this metric through the WAREHOUSE_EVENTS_HISTORY view of ACCOUNT_USAGE.
|
SELECT warehouse_name, COUNT(*) AS resume_count FROM SNOWFLAKE.ACCOUNT_ USAGE.WAREHOUSE_EVENTS_HISTORY WHERE EVENT_NAME = ‘RESUME_WAREHOUSE’ AND TIMESTAMP >= DATEADD(‘day’, -7, CURRENT_TIMESTAMP()) GROUP BY warehouse_name ORDER BY resume_count DESC; ORDER BY resume_count DESC; ; |
Query Concurrency per Warehouse
Query concurrency means how many queries are running on each warehouse at the same time. This metric is important to identify underused and maxed-out warehouses. Once you have this information, you can scale down underused resources and figure out whether you need to scale up the overused warehouses or it’s more cost-effective to split across additional compute clusters.
You can monitor this metric through the WAREHOUSE_LOAD_HISTORY views of ACCOUNT_USAGE.
|
SELECT warehouse_name, start_time, end_time, avg_running AS concurrent_queries FROM SNOWFLAKE.ACCOUNT_USAGE .WAREHOUSE_LOAD_HISTORY WHERE start_time >= DATEADD(‘day’, -1, CURRENT_TIMESTAMP()) ORDER BY start_time DESC; |
Serverless Feature Credit Usage
It was very common to ignore the cost of serverless features run outside user-managed warehouses and are billed separately. These tasks include automatic clustering, materialized view refreshes, and search optimization. Fortunately, Snowflake has independent views for all of them to track how much credits are being consumed.
You can find these metrics in the SERVERLESS_TASK_HISTORY, MATERIALIZED_VIEW_REFRESH_HISTORY, and SEARCH_OPTIMIZATION_HISTORY views.
SELECT task_name, SUM(credits_used) AS total_credits FROM SNOWFLAKE.ACCOUNT_USAGE .SERVERLESS_TASK_HISTORY WHERE start_time >= DATEADD(‘day’, -7, CURRENT_TIMESTAMP()) GROUP BY task_name ORDER BY total_credits DESC; |
Metrics to Monitor Storage Cost
Next, we will look into the metrics that must be monitored for optimizing storage cost in Snowflake. Although storage is more affordable than compute, lack of monitoring can lead to unwanted surprises. For example, retaining large tables, unused temp files, or long time travel windows can all lead to bloated bills. Let’s discuss how we can keep them at bay.
Storage Usage by Table
This metric helps you identify which tables are consuming the most storage. You can use it to locate large or unnecessary tables that might need pruning or archiving.
You can monitor this metric through the TABLE_STORAGE_METRICS view of ACCOUNT_USAGE.
SELECT table_catalog AS database_name, table_schema, table_name, active_bytes / 1024 / 1024 / 1024 AS active_gb FROM SNOWFLAKE.ACCOUNT_USAGE .TABLE_STORAGE_METRICS ORDER BY active_gb DESC; |
Time Travel Storage Usage
The time travel feature of Snowflake is very useful as it stores historical versions of your data. However, it’s important to use optimal settings for time travel to avoid a massive surge in your Snowflake bill.
You can monitor this metric through the TABLE_STORAGE_METRICS view of ACCOUNT_USAGE.
|
SELECT table_catalog AS database_name, table_schema AS schema_name, table_name AS table_name, time_travel_bytes / 1024 / 1024 / 1024 AS time_travel_gb FROM SNOWFLAKE.ACCOUNT_USAGE .TABLE_STORAGE_METRICS WHERE time_travel_bytes > 0 ORDER BY time_travel_gb DESC; |
Fail-safe Storage Usage
Fail-safe can be considered an extended version of time travel as it provides a 7-day non-configurable backup beyond the time travel window. The cost of this storage can become a huge problem if you have large historical datasets.
You can monitor this metric through the STORAGE_USAGE view of ACCOUNT_USAGE.
|
SELECT usage_date, FAILSAFE_BYTES / 1024 / 1024 / 1024 AS failsafe_gb FROM SNOWFLAKE.ACCOUNT_ USAGE.STORAGE_USAGE WHERE usage_date >= DATEADD(‘day’, -7, CURRENT_DATE()) ORDER BY usage_date DESC; |
Stage and Temporary Table Storage
Internal stages and temporary tables are often left behind after ETL or testing. These tables can cause a significant boost to your Snowflake spend if you don’t clean them up regularly.
You can monitor this metric through the STAGE_STORAGE_USAGE_HISTORY view of ACCOUNT_USAGE (for Stage Tables) and INFORMATION_SCHEMA.TABLES (for Temp Tables).
|
SELECT usage_date, AVERAGE_STAGE_BYTES / 1024.0 / 1024.0 / 1024.0 AS storage_gb FROM SNOWFLAKE.ACCOUNT_USAGE .STAGE_STORAGE_USAGE_HISTORY WHERE usage_date >= DATEADD(‘day’, -7, CURRENT_DATE()) ORDER BY usage_date DESC; |
|
— List temporary tables SELECT table_catalog, table_schema, table_name, created FROM INFORMATION_SCHEMA.TABLES WHERE table_type = ‘TEMPORARY’; |
Unused or Low-Access Tables
It is very common for Snowflake users to create temporary tables and then leave them in the system. Although they are not being queried, these tables can contribute to your bill. Therefore, it’s critical to monitor, identify, and clean up such tables to optimize Snowflake cost.
You can monitor this metric through the TABLES and QUERY_HISTORY view of ACCOUNT_USAGE.
— This only works if you have Enterprise Edition on Snowflake. WITH accessed AS ( SELECT DISTINCT obj.value:”databaseName”::string AS database_name, obj.value:”schemaName”::string AS schema_name, obj.value:”objectName”::string AS object_name FROM SNOWFLAKE.ACCOUNT_USAGE .ACCESS_HISTORY ah , LATERAL FLATTEN(input => ah.DIRECT_OBJECTS_ACCESSED) obj WHERE ah.QUERY_START_TIME >= DATEADD(‘day’, -30, CURRENT_TIMESTAMP()) — last 30 days AND obj.value:”objectDomain”::string = ‘TABLE’ ) SELECT t.table_catalog AS database_name, t.table_schema AS schema_name, t.table_name FROM SNOWFLAKE.ACCOUNT_USAGE.TABLES t LEFT JOIN accessed a ON t.table_catalog = a.database_name AND t.table_schema = a.schema_name AND t.table_name = a.object_name WHERE t.deleted IS NULL AND a.object_name IS not NULL — never accessed in that 30-day window ORDER BY 1,2,3; |
Metrics to Monitor Query Cost
Every query that you run in Snowflake has the potential to consume warehouse credits. For this reason, it’s imperative to find inefficiencies and tune performance to reduce costs without sacrificing productivity. Below are some of the key query-related metrics to track.
Query Execution Time and Credit Usage
Long-running queries consume significant warehouse resources and monitoring their execution times and credit usage is a necessity. It helps you pinpoint expensive operations and prioritize optimization to control your Snowflake spend.
You can monitor this metric through the QUERY_ATTRIBUTION_HISTORY and QUERY_HISTORY views of ACCOUNT_USAGE.
|
— most expensive queries by compute cost SELECT query_id, user_name, warehouse_name, start_time, credits_attributed_compute FROM SNOWFLAKE.ACCOUNT_USAGE.QUERY _ATTRIBUTION_HISTORY WHERE start_time >= DATEADD(‘day’, -7, CURRENT_TIMESTAMP()) |
|
— queries with highest execution_time SELECT query_id, user_name, warehouse_name, total_elapsed_time/1000 AS exec_seconds, query_text FROM SNOWFLAKE.ACCOUNT_USAGE .QUERY_HISTORY WHERE start_time >= DATEADD(‘day’, -7, CURRENT_TIMESTAMP()) |
Bytes Scanned per Query
The amount of data processed for each query is directly proportional to compute costs. Hence, this metric is important to identify inefficient queries, like SELECT * statements.
You can monitor this metric through the QUERY_HISTORY view of ACCOUNT_USAGE.
SELECT query_text, warehouse_name, bytes_scanned / 1024 / 1024 / 1024 AS scanned_gb FROM SNOWFLAKE.ACCOUNT_USAGE .QUERY_HISTORY WHERE start_time >= DATEADD(‘day’, -7, CURRENT_TIMESTAMP()) ORDER BY scanned_gb DESC LIMIT 50; |
Query Frequency
Some queries are light, but they run thousands of times a day. More often than not, it is happening unnecessarily and causing a lot of hits to your bill. Optimizing the frequency of these queries can help you save a lot.
You can monitor this metric through the QUERY_HISTORY view of ACCOUNT_USAGE.
SELECT query_text, COUNT(*) AS frequency FROM SNOWFLAKE.ACCOUNT_USAGE .QUERY_HISTORY WHERE start_time >= DATEADD(‘day’, -7, CURRENT_TIMESTAMP()) GROUP BY query_text ORDER BY frequency DESC LIMIT 20; |
Failed or Retried Query Counts
Queries that fail repeatedly waste resources and monitoring them helps you fix issues at the source. Whether it is happening due to application errors, incorrect logic, or unstable pipelines, this metric has got you covered.
It can be monitored through the QUERY_HISTORY view of ACCOUNT_USAGE.
SELECT query_text, execution_status, COUNT(*) AS attempts FROM SNOWFLAKE.ACCOUNT_USAGE .QUERY_HISTORY WHERE start_time >= DATEADD(‘day’, -7, CURRENT_TIMESTAMP()) AND execution_status != ‘SUCCESS’ GROUP BY query_text, execution_status ORDER BY attempts DESC LIMIT 20; |
Snowflake’s flexible pricing model is great for scaling workloads, but without active monitoring, costs can add up quickly. However, it must be kept in mind that monitoring cost isn’t a one-time task—it’s an ongoing process. Leverage the available tools (like Account Usage views, Resource Monitors, and Snowsight) to track the right metrics and control your budget by monitoring Snowflake cost.
FAQ
Compute usage from virtual warehouses is the biggest cost driver, followed by serverless features and storage.
Query the WAREHOUSE_METERING_HISTORY view to see credits used by each warehouse over time and sort by total credits.
Yes, use Budgets for soft alerts and Resource Monitors to suspend warehouses when usage crosses defined credit thresholds.


